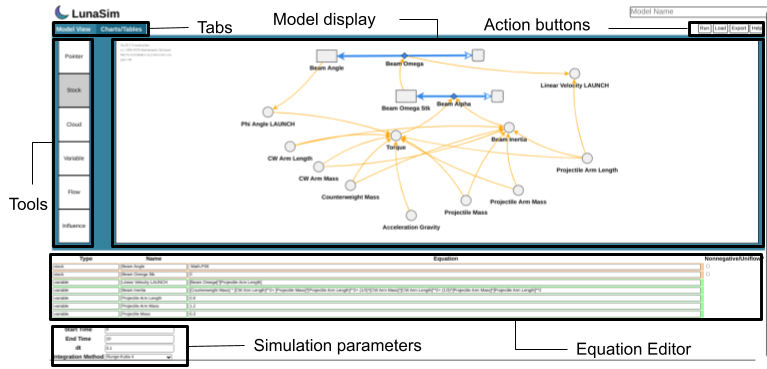
User Manual for LunaSim
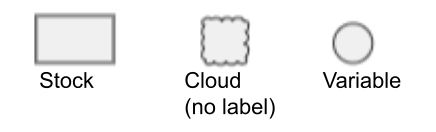
Nodes are stocks, clouds, or variables. They must be created on the “Modal View.”
To add them to the model: click the tool then click on the model display.
To change their label: click on the default and rename it to something unique
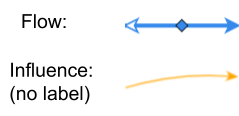
Links connect different nodes on the “Modal View” tab. They include flows and influences.
To add them to the model: click on a node and drag to another node.
To change their label: click on the default and rename it to something unique
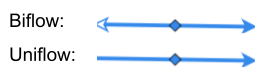
Flows connect: stock-stock, stock-cloud, or cloud-cloud
Influences connect: variable-variable, variable-flow, stock-variable, stock-flow, flow-variable, or flow-flow
All the labeled entities (nodes and links) will be loaded into the equation editor.
Equations:
Checkboxes:
The entities with checkboxes include stocks and flows. A checked box can make a stock non-negative and turns a biflow into a uniflow.
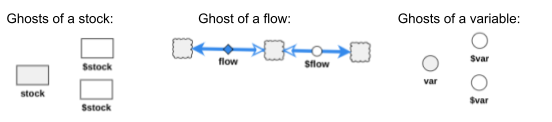
Ghosting creates a duplicate of an entity (stocks, flows, and variables) in the model, but ghosts of the same entity will behave as one in the equation. To create a ghost: rename a node so that it begins with a ‘$.’
*Make sure that ghosts have the same name and are the correct entity
Charts can be used to graph the value of nodes over either time or over the values of another node.
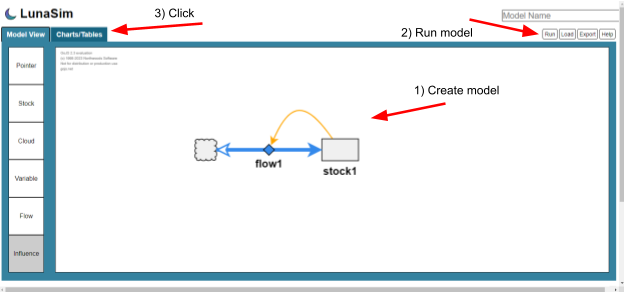
Step 1:
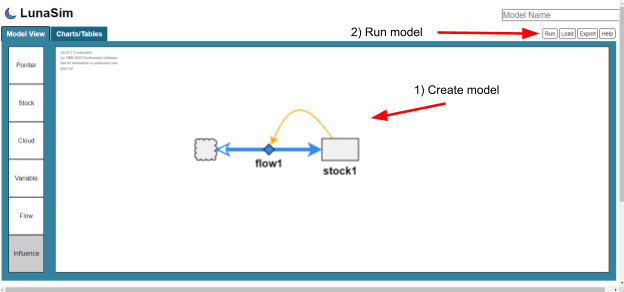
To create a Chart, you must first create and run a model. Then, you can click on the Charts/Tables tab.
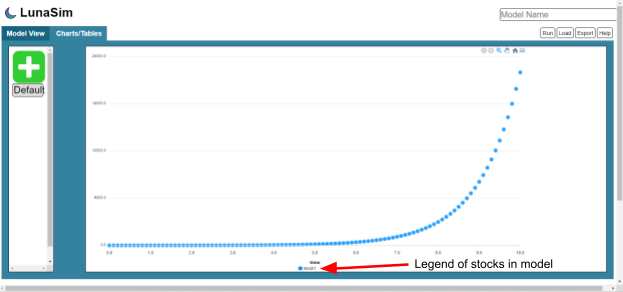
Once you click on the Charts/Tables tab, you will be greeted by a default chart which plots the values of all of the stocks in your model over time.
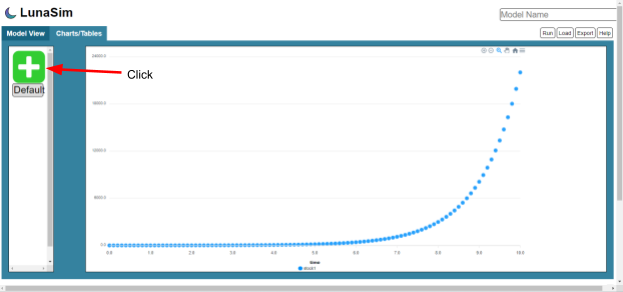
Step 2:
To create your own chart or table, click on the green and white plus button on the left.
Step 3:
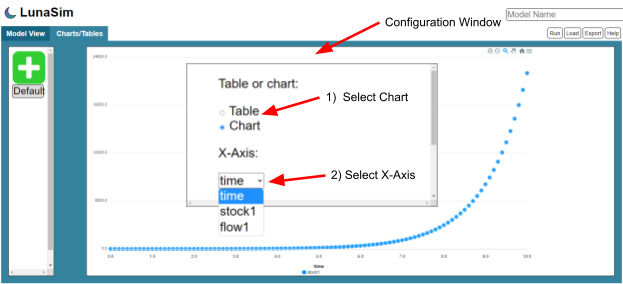
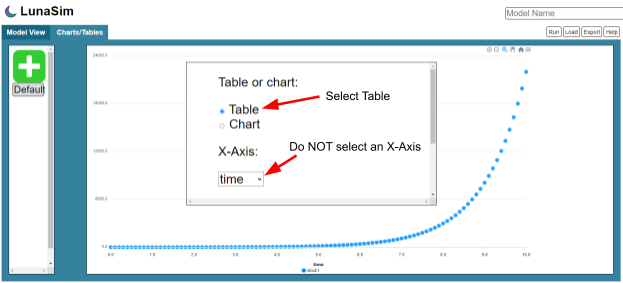
A configuration window will pop up. Select “Chart” and the x-axis you want to plot over.
Step 4:
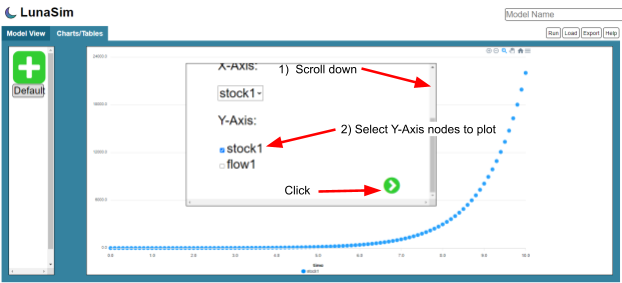
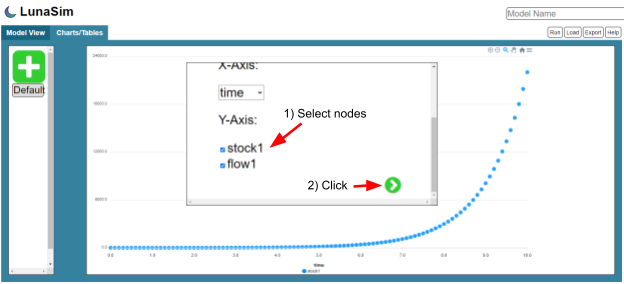
Scroll down and select the nodes you want to plot on the Y-Axis. You can select multiple nodes. Finally, click on the green and white arrow button.
Step 5:
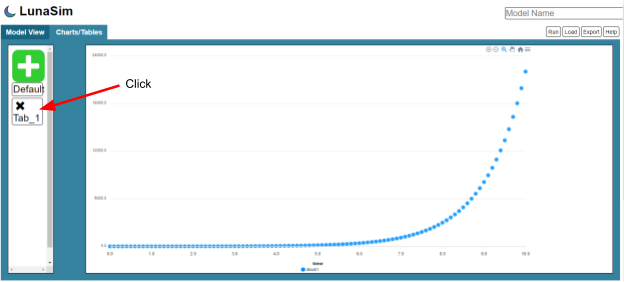
Your chart will be created and stored in a new tab. Click on the tab that was created from the left sidebar.
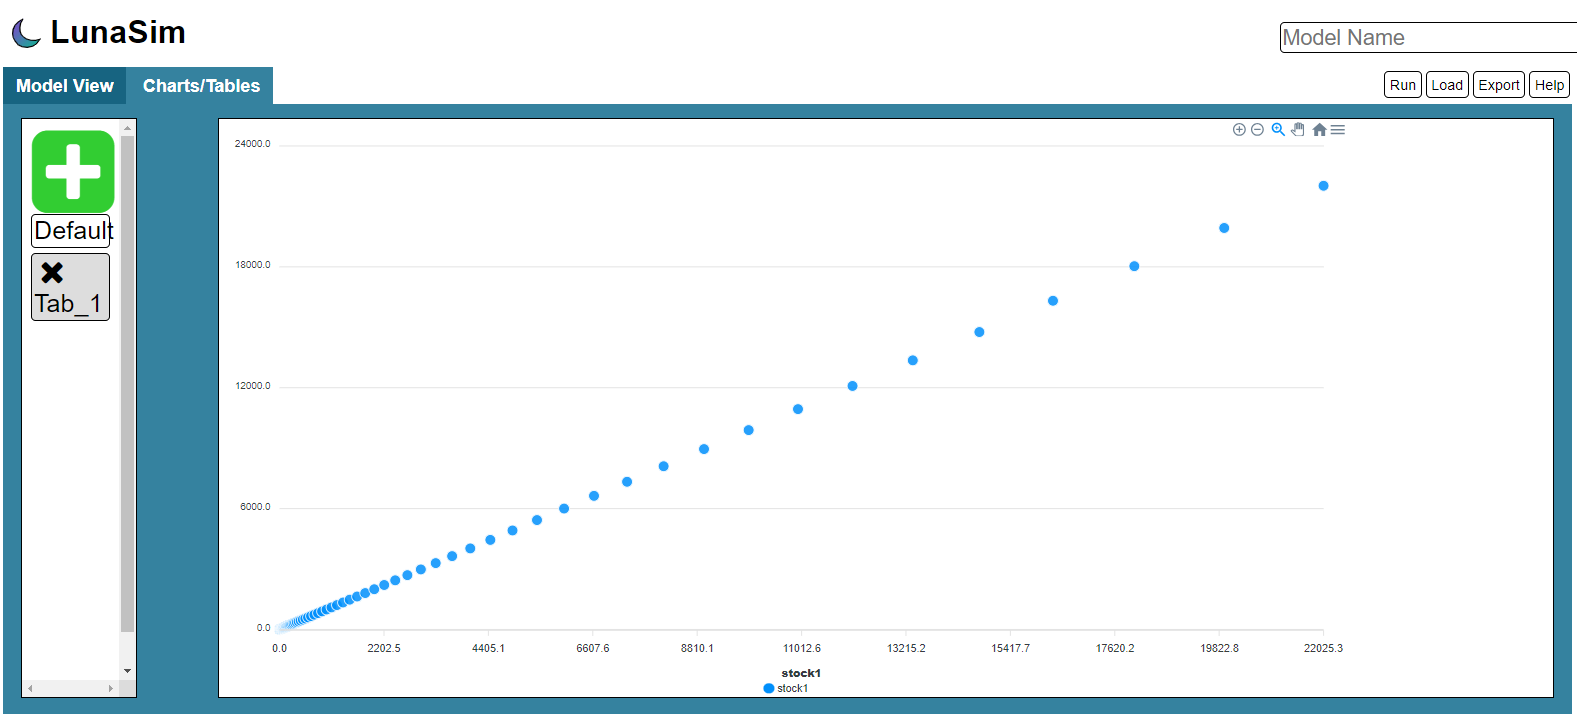
Now you should see the new chart you made. You can hover over points to see their value.
Tables can be used to see the value of nodes over time.
Step 1:
Refer to VI. Creating Charts, and follow steps 1 through 2.
Step 2:
Select “Table.” Do NOT select an X-Axis. Time will always be the leftmost column.
Step 3:
Select the nodes you want to see on the table. Click on the green and white arrow button.
Step 5:
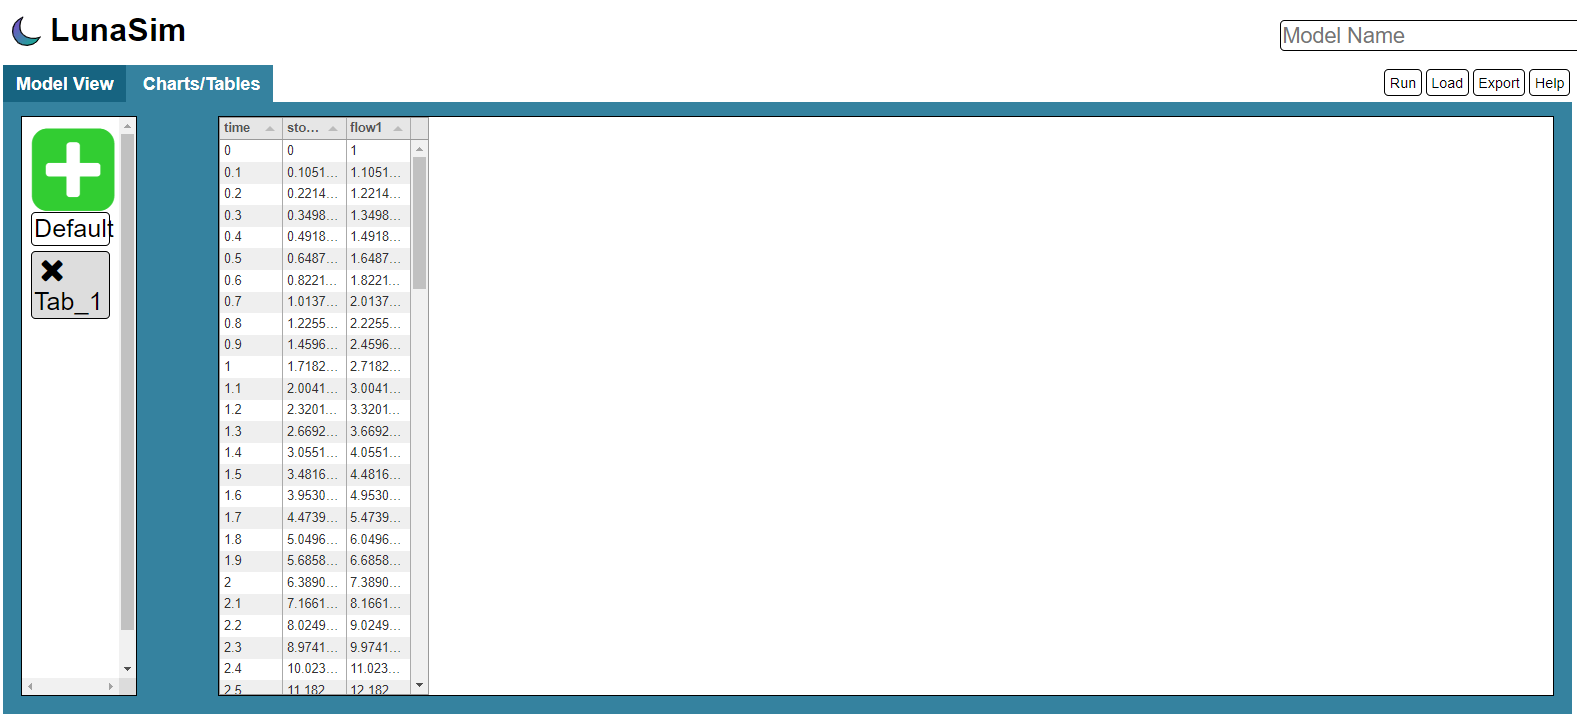
Your table will be created and stored in a new tab. Click on the tab that was created from the left sidebar.
Now you should see the new table you made. You can drag the inner borders of the table to expand it.
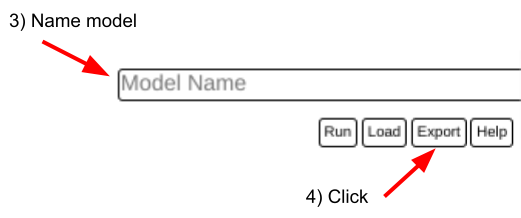
First, create and run a model to export. Be sure to set the desired simulation parameters and equations.
Next, name the model and click the “Export” button.
If the model is unnamed, the downloaded file will be named “luna.txt.” If the model is named, the downloaded file will be named “[Model Name] + .luna.”
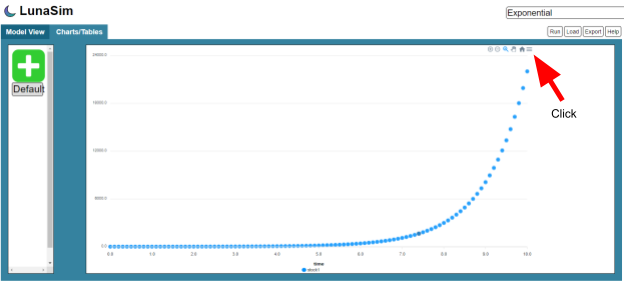
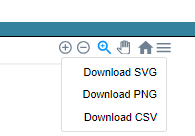
Create a chart as described in the Creating Charts section.
SVG and PNG files are charts, and CSV files are tables.
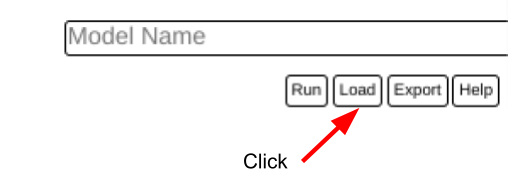
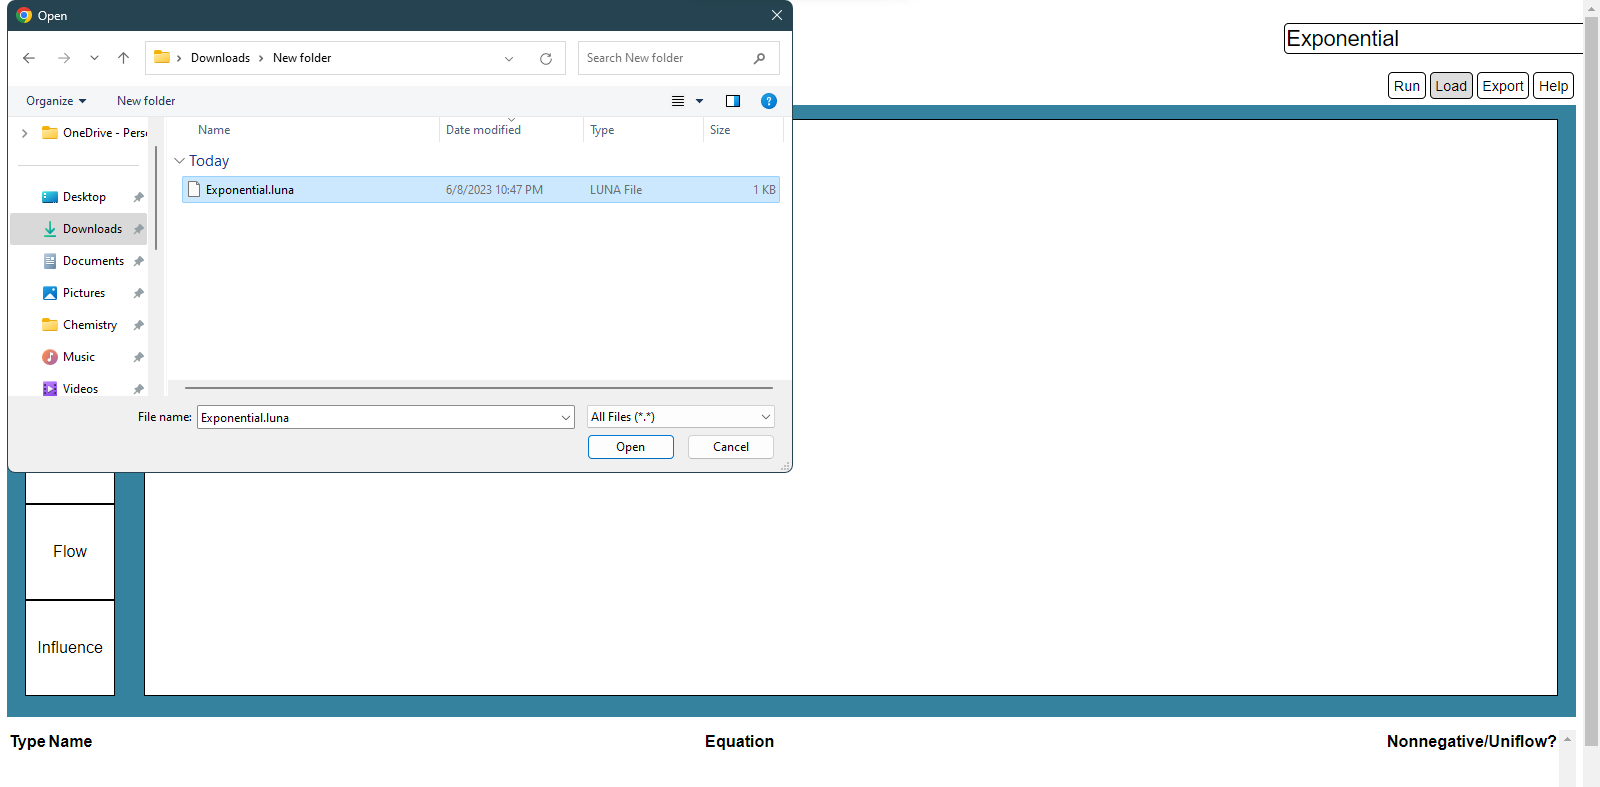
Click the “Load” button and select either a LUNA or a TXT file (preferably LUNA).
*A TXT file should be in the same format as a LUNA file
The model, equations, and simulation parameters should be updated.